LiDAR Corridor Surveys: Grid Vegetation Becomes Measurable
Half a million euros for one fallen tree. Numbers like that kept corridor patrols walking for decades, binoculars in hand. Now the point cloud takes over, and it sees a third more than the estimators did.
In August 2025, Netze BW captured around 3,600 kilometres of high-voltage corridors and 266 substations by helicopter LiDAR and now finds roughly a third more vegetation risks than its previous estimation methods did. The stakes were high anyway, a single tree strike can cost up to 500,000 euros. E.DIS took the satellite route: after a 6,000-kilometre pilot, LiveEO's analysis now covers the entire medium-voltage network, with costs down 30 percent and reliability up 15 percent according to the vendor. Add BVLOS drones at Westnetz and the SIEAERO consortium, and the bottleneck is rarely the technology. It is the process behind it: risk list, prioritisation, trimming inside the legal cutting window from October to February. The buried cables inside that same network are assessed instead through medium-voltage cable diagnostics.
Vegetation is the underrated grid risk
Not an exotic incident but routine: the tree in the medium-voltage line. Fabian Grabowski, a field technician at Netze BW, puts the bill for a single strike at up to half a million euros. And yet corridors were checked for decades the way a grandfather would have done it. On foot along the line. With binoculars. By feel.
That sounds like a solved problem, and the German regulator does rank the country's grid among Europe's most reliable. But the SAIDI only stays at 11.7 minutes for as long as the corridors stay clear. External impact and weather sit high on the VDE FNN cause lists, and extreme weather keeps getting more frequent. A storm doesn't fell healthy clearances. It fells the trees that already stood too close.
Built into every estimation method is the same flaw. It cuts too late, or in the wrong place. Usually a little of both.
What a LiDAR survey actually delivers
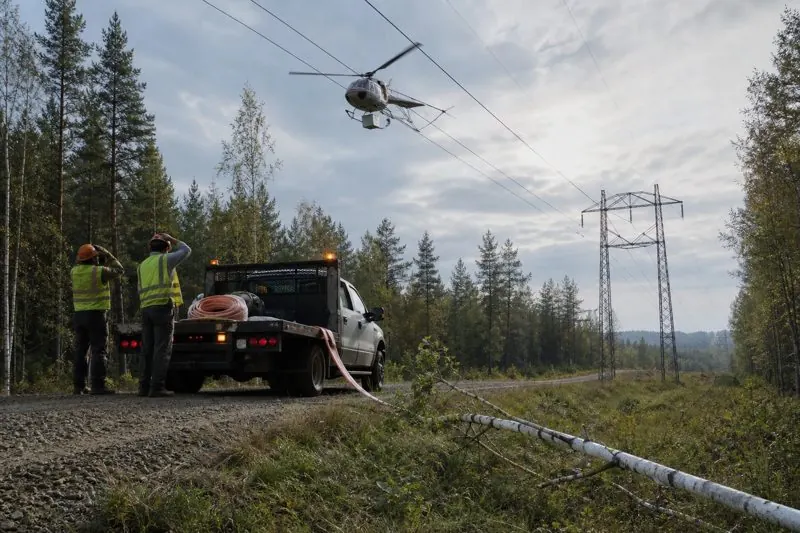
In August 2025, a special helicopter flew about 3,600 kilometres of high-voltage corridors in Baden-Württemberg for Netze BW, plus 266 substations, from roughly 110 metres up. On board: a LiDAR system sweeping the surroundings with laser pulses.

What no human sees from the ground, the point cloud accounts for. Conductor sag under full load and summer heat. Cable movement in wind. A two-year growth forecast for every single tree. When Netze BW held this analysis against its old estimation methods, the estimators turned out to have missed about a third of the vegetation risks. A third. That surprised the field crews themselves.
Dr Sophie Crommelinck, product owner at Netze BW, describes the effect dryly: identified faster, trimmed faster than with patrol drives. The risks land in the company's TIP app, where field crews, authorities and contractors look at the same data, and the coordination loops disappear. NETZinspect 2.0 goes further still, with drone imagery and AI analysis. What image recognition can do on pylons and insulators is covered in our article on AI drone inspection.
Satellite, helicopter or drone: which for what
Vendor slides like to stage a contest between the three capture methods. In practice they answer different questions, and the interesting decision is the order in which you use them.
| Tool | Strength | Limit |
|---|---|---|
| Satellite | Sees the whole network again and again, no aircraft | Coarser picture; elevation model needs support data |
| Helicopter LiDAR | Centimetres, sag under load, per-tree growth forecast | Costly, grounded by weather, one snapshot per campaign |
| Drone | Close-ups, re-checks after trimming, quick to launch | Needs a BVLOS authorisation; range stays limited |
What this looks like in practice? E.DIS has played it through. First a pilot corridor, 6,000 kilometres of medium voltage, analysed from satellite imagery by LiveEO. Then the rollout across the entire medium-voltage network. According to the vendor, costs fell by 30 percent and reliability rose by 15 percent.
Worth remembering before you quote this onwards: both numbers come from LiveEO, the party selling the solution. An independent comparison across several grid operators does not exist yet. Fine as a direction, a business case only after your own maths.
The combination is where it gets interesting. LiDAR terrain models from survey flights sharpen the satellite analysis, after which the satellite takes over continuous monitoring of the area. Which leaves the drone. Westnetz already flies inspections beyond visual line of sight with Beagle Systems, one of the few BVLOS authorisations in Germany. The first such flight at critical infrastructure under the simplified EASA operator certificate came from the SIEAERO consortium of SH Netz, Bayernwerk and Siemens Energy. SH Netz already knew what data volumes mean. The digital twin of its high-voltage network: 3,000 kilometres, 900,000 gigabytes, up to 12,000 images per kilometre.
The European picture
The frame around all this is tighter than the tech enthusiasm suggests. Three sets of rules have a say.
Aviation law first. BVLOS flights run under the EU drone regulation and need an operational authorisation, in Germany based on the SORA 2.5 methodology since 2026; anyone planning to scale treats that authorisation as a project of its own. Then nature conservation: heavier woody cutting is banned from 1 March through 30 September, five winter months remain, and a risk list that only lands in January has already wasted half of them. Incentive regulation, last, quietly rewards all of this. Efficiency gains from remote sensing feed straight into the revenue cap.
Corridor maintenance itself is changing too. Clear-cutting is yesterday. Germany's VDE FNN advocates ecological corridor management in its guidance note: tiered vegetation, low shrubs under the line, taller growth at the edges. Good for biodiversity, cheaper to maintain over time. It only works, though, with exactly the data this article is about. Only those who know what grows where can maintain selectively.
To be straight about it: how large the exact share of vegetation-related faults in the German medium-voltage grid is, the public VDE FNN statistics do not break out. What is documented are overall fault rates and the cost impact of individual tree strikes. If you argue internally, analyse your own outage history instead of quoting an industry figure that does not exist in that form.
Challenges and risks
The technology is mature. Self-running it is not.
The costliest mistake, though, has nothing to do with technology. It is buying a capture solution and not the process behind it. The most precise risk list changes nothing in the outage statistics as long as nobody turns it into work orders.
What grid operators should do now
Nobody needs a mega-project for this. The entry is a sequence of clear steps, and the first one costs nothing but a few days in your own outage archive.

Six steps, in this order
-
Analyse the outage history
Count them. How many medium- and high-voltage faults of the past five years traced back to vegetation, and where do they cluster? That count is the business case. Skip it and you are debating vendor slides.
-
Check the corridor register
Corridor routes, tree stock, past trimming: does your GIS actually hold them, and are they right? Remote sensing only analyses what it can locate.
-
Set the tool mix
Satellite buys coverage and revisit rate. LiDAR buys precision campaigns. Drones buy detail and follow-up. Not either-or, a sequence.
-
Price out a pilot corridor
Take one bounded corridor and run the vendor promises against your own fault and maintenance costs. E.DIS piloted across 6,000 kilometres. A tenth of that works too.
-
Close the loop to the trimming order
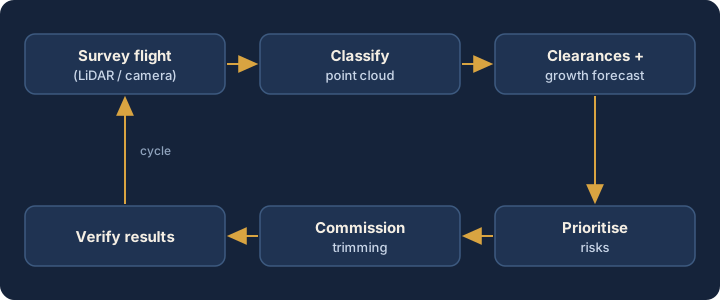
Risk list, prioritisation, commissioning, verification. One system, contractors included, the TIP app is the model. The value sits in the execution chain, not in the scan.
-
Plan around the cutting window
Heavier trimming stops on 1 March and stays off-limits until October. Which means the risk list has to stand in autumn. Or it waits a year.
In the end some will buy the same solution as the neighbouring operator. The difference: they will know why, and what to measure its success against.
Further reading
Frequently asked questions
Airborne laser scanning of a power line corridor. A helicopter or drone sweeps line, pylons and vegetation with laser pulses, producing a centimetre-accurate 3D point cloud complete with conductor sag and a growth forecast per tree. Netze BW captured around 3,600 kilometres of high-voltage corridors this way in August 2025.
One tree is enough. If it falls into the line, repair, outage and compensation add up to as much as 500,000 euros, according to a Netze BW field technician. The quieter cost block is trimming in the wrong place. That ties up budget which is then missing at the critical spot.
The satellite never lands. It revisits the whole network at a rhythm no helicopter can afford, though at coarser resolution than the laser. E.DIS ran a 6,000-kilometre pilot and then moved its whole medium-voltage network across; the 30 percent cost cut and 15 percent reliability gain doing the rounds are LiveEO's own figures.
Detail and speed. Drones deliver close-ups, verify trimming afterwards and fly at short notice, say after a storm. The catch is called BVLOS: flights beyond visual line of sight need an authorisation few providers hold so far. Westnetz already flies them, with Beagle Systems.
From early October to the end of February. For the rest of the year, the Federal Nature Conservation Act bans heavier woody cutting. Five months of window, no more, which is exactly why data-based prioritisation pays off. Whoever holds a solid risk list in October wastes no cutting season.
In the outage archive. Count where vegetation faults cluster, check the corridor register, then price one pilot corridor. Do those three things and the tooling question has mostly answered itself.
Let's collaborate
One contact, a team behind it
Thirty minutes on what you're working on, whether grid, metering, market processes, IT architecture or AI. Afterwards you'll know how we'd approach it and who would sit at the table.
Energy and measurement technology since 2010 · innobu GmbH since 2014 · Based in Schleswig-Holstein, Germany
Whoever pitches also delivers: whoever leads the first call stays your contact right through to the steering committee, with established partners in the project. Direct: info@innobu.com