AI in District Heating: Network Optimization and the Transformation Plan under WPG
Two deadlines, one dataset. The transformation plan is due by the end of 2026, and fuel prices push at the same time.
The biggest efficiency lever in a heat network is a low network temperature. Lowering the return temperature from 60 to 40 degrees Celsius raises the usable capacity of a network section by up to 70 percent, and only low temperatures make large heat pumps, solar thermal and waste heat efficient. Machine learning starts exactly here. The dena guide sorts the network-side use cases into load forecasting, return temperature optimization, predictive maintenance and leak and anomaly detection. The results are documented: at enercity in Hanover, a self-learning control lowered the supply temperature by 8 to 10 Kelvin and the return temperature by up to 10 Kelvin, at around 9 percent savings, with a rollout to around 5,000 buildings by 2027. In the dena project ML4FW, optimized controller parameters alone delivered return temperatures 2 to 3 Kelvin lower. The precondition is a clean data foundation from smart metering, SCADA and a GIS network model, joined into a digital twin. The same foundation is required by the heat network expansion and decarbonisation roadmap under Section 32 WPG, due by the end of 31 December 2026. Operators who think of operation and roadmap together do the work once instead of twice.
Why network temperature becomes a compute problem
District heating loses energy on every metre of pipe. The biggest lever against it is unglamorous: a low network temperature. Lowering the return pulls more capacity out of the same network and makes room for renewable sources that only run efficiently at low temperatures. The art is to lower it far enough that no apartment goes cold. Gut feeling does not cut it. It is a compute task with many variables, and that task can be solved differently today than it could ten years ago.
One simple number shows how big the lever is: lowering the return temperature from 60 to 40 degrees Celsius raises the usable heat capacity of a network section by up to 70 percent. Low temperatures are also the precondition for a large heat pump to feed the network efficiently, as with solar thermal and waste heat. This is what network optimization is about.
The pressure comes from two sides. High fuel costs and scarce renewable heat force operators to save every Kelvin. And the legislator demands a plan by the end of 2026 for how the network becomes renewable. Both come down to the same question: how does the network really behave, and where can it be run more efficiently?
What AI delivers on the network side
Machine learning does not replace an engineer, but it computes faster and learns from every operating day. The dena guide "AI in District Heating" sorts the use cases into five fields that interlock on the network side. Three of them have the biggest lever on temperature and losses.
The three central fields interlock like this:
- Load forecasting: Models predict heat demand per network section from weather, calendar and consumption history. LSTM-based methods reached up to 25 percent lower forecast error than conventional methods in documented applications. A better forecast makes it possible to run the supply temperature tighter.
- Return temperature optimization: Self-learning controls run the temperature dynamically to the real demand minimum instead of a fixed safety margin. That is the most direct route to fewer network losses and more room for renewable feed-in.
- Anomaly and leak detection: Autoencoders learn the normal behaviour of the network and flag deviations, such as unexpected continuous consumption or atypical night loads that point to a leak. A fault becomes visible early, before it gets expensive.
The difference to generation-side optimization matters. How the operation optimization of the heat centre solves the generation park as a scheduling problem is described elsewhere by innobu. Here it is about the network itself: the temperatures, loads and the condition of the pipes between generation and transfer.
From measurement to model: the data foundation
AI is only as good as the data it learns from. Without meter readings, network measurements and a clean network model, every model stays blind. Here is the part that often gets missed: this is exactly the foundation an operator builds anyway when taking the transformation plan seriously. The effort pays off twice.

Three data sources form the base:
- Smart metering: Remotely readable heat meters deliver consumption profiles per transfer station, fine-grained and timely. That is the raw material for any load forecast.
- SCADA: The control system delivers network measurements in real time, supply and return temperatures, pressures and flows. Without these time series, no model can learn the real behaviour.
- GIS network model: A geographic information system locates pipes, diameters, lengths and transfer points. It turns single measurements into a connected network.
Brought together, these sources form a digital twin: a running hydraulic-thermal image of the network. On it, load changes, switchovers and lowering strategies can be modelled virtually before anything is touched in the real network. How municipal heat planning builds its data foundation through a digital heat cadastre shows that the data work rarely starts from zero.
Evidence from the field
Lab numbers convince nobody. These come from running networks. They show the effect is real and repeatable, as soon as data foundation and control fit together.
At enercity in Hanover, a self-learning control lowered the supply temperature by 8 to 10 Kelvin and the return temperature by up to 10 Kelvin, at around 9 percent energy savings. From the pilot with 100 multi-family buildings, the approach is set to grow to around 5,000 buildings by 2027, with an expected 50,000 MWh of heat and 5,000 tonnes of CO2 saved per year. In the dena project ML4FW, the AI-based optimization of the controller parameters alone delivered return temperatures 2 to 3 Kelvin lower.
The results are not a one-off. Wherever meter readings, SCADA data and a network model come together, AI lowers the network temperature measurably and repeatably. The effect starts with a well-measured sub-network and grows with the rollout.
How AI supports the transformation plan under Section 32 WPG
Under Section 32 WPG, every operator of a heat network not fully supplied from renewables or unavoidable waste heat must create a heat network expansion and decarbonisation roadmap under Annex 3 by the end of 31 December 2026, publish it on the website and submit it to the competent authority. Networks under one kilometre in length are exempt, and operators who filed a BEW funding application by the end of 2025 are released from the duty. The roadmap must be reviewed at least every five years.
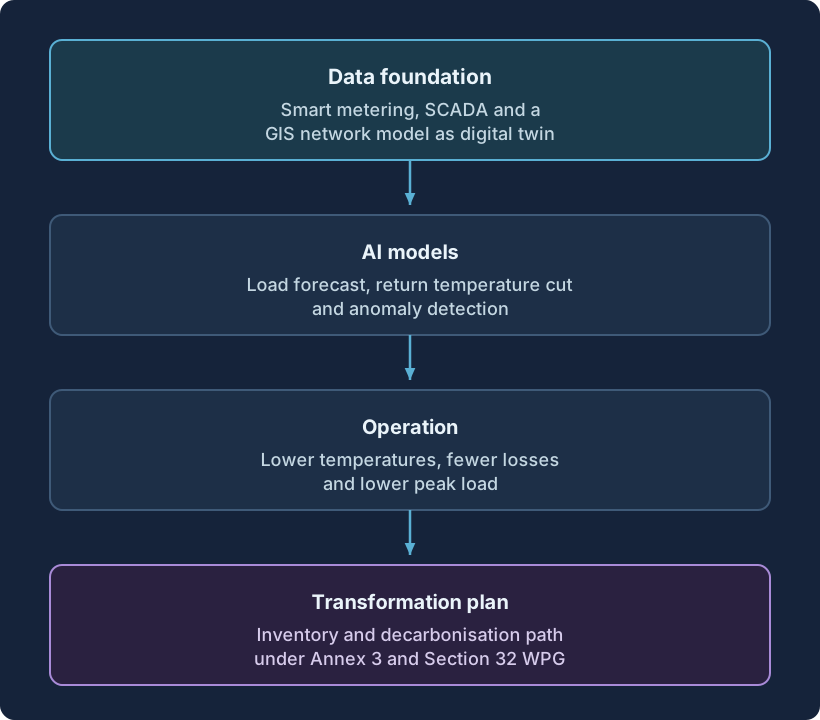
The roadmap requires a robust inventory, load analyses and a path to decarbonisation. These are the same data and models that optimize operation. Operators who separate the two do the work twice. Those who think of it together save effort and get a documented plan.
- Inventory: The digital network model and the load profiles from smart metering deliver the data foundation that Annex 3 requires anyway.
- Scenarios: Lowering strategies and the connection of renewable sources can be modelled on the digital twin before they are written into the roadmap.
- Decarbonisation path: The documented temperature and consumption reductions become a traceable part of the path, not an estimate.
Anyone looking for the regulatory content in detail will find it in the article on the decarbonisation roadmap under Section 32 WPG. This article shows how the data work for operation and roadmap becomes the same task.
What operators should do now
The path is plannable when data foundation and deadline are thought of together. Operators who first optimize the control and then write the roadmap do the work twice. Three steps put it in shape.

-
Check the data foundation
Assess how complete meter readings, the SCADA connection and the network model are. Where measurement points are missing or the GIS is patchy, any later AI goes blind. The inventory for the roadmap uncovers the same gaps, so survey them together.
-
Start with the biggest lever
Pilot the return temperature reduction on a well-measured sub-network. That is where the effect is fastest to see and the risk is smallest. A documented partial success carries the rollout better than a network-wide leap into the unknown.
-
Feed the results into the roadmap
Write the documented reductions and the modelled scenarios directly into the Section 32 roadmap and plan the 31 December 2026 deadline backwards. That turns operation optimization into a traceable decarbonisation path.
Network-side AI lowers the network temperature measurably and at the same time delivers the data foundation that the transformation plan under Section 32 WPG requires. Operators who check the data foundation early, start with the return temperature reduction on a sub-network and feed the results into the roadmap save fuel and meet the deadline with documented numbers rather than estimates.
Further reading
Frequently asked questions
On the network side, machine learning mainly lowers supply and return temperatures, forecasts the heat load and detects leaks and anomalies. At enercity in Hanover, a self-learning control lowered the supply temperature by 8 to 10 Kelvin and the return temperature by up to 10 Kelvin, at around 9 percent energy savings. In the dena project ML4FW, optimized controller parameters alone delivered return temperatures 2 to 3 Kelvin lower.
A low return temperature is the central efficiency lever in a heat network. Lowering it from 60 to 40 degrees Celsius raises the usable heat capacity of a network section by up to 70 percent. Low temperatures are also the precondition for large heat pumps, solar thermal and waste heat to feed in efficiently.
The foundation is consumption profiles from smart metering per transfer station, real-time network measurements from the SCADA system and a GIS-based network model with pipes, diameters and transfer points. A digital twin connects this data into a running hydraulic-thermal image of the network, on which lowering scenarios can be modelled in advance.
The heat network expansion and decarbonisation roadmap under Section 32 WPG requires a robust inventory, load analyses and a path to decarbonisation under Annex 3. The same data and models that optimize operation provide the basis for this proof. Lowering scenarios can be modelled on the digital twin and the documented reductions become part of the decarbonisation path.
Every operator of a heat network not fully supplied from renewables or unavoidable waste heat must create the heat network expansion and decarbonisation roadmap by the end of 31 December 2026, publish it on the website and submit it to the competent authority. The roadmap must be reviewed at least every five years. Networks under one kilometre in length are exempt.
Let's collaborate
One contact, a team behind it
Thirty minutes on what you're working on, whether grid, metering, market processes, IT architecture or AI. Afterwards you'll know how we'd approach it and who would sit at the table.
Energy and measurement technology since 2010 · innobu GmbH since 2014 · Based in Schleswig-Holstein, Germany
Whoever pitches also delivers: whoever leads the first call stays your contact right through to the steering committee, with established partners in the project. Direct: info@innobu.com