AI in balancing group management: cutting imbalance energy cost with data analytics
Balance responsible parties in Germany must keep their balancing group in balance in every quarter hour, a duty set out in section 4(2) of the electricity grid access ordinance. Every deviation is settled at the single imbalance price across control areas, symmetrically for shortfall and surplus. The price comes from three modules: a price component drawn from the balancing platforms PICASSO and MARI, a coupling to the intraday index with a minimum spread of 25 percent or 10 euros per megawatt hour above a 500 MW control area balance, and a scarcity component above 80 percent utilisation of the dimensioned reserve capacity. On the value of AI there are solid figures from narrow cases: Fraunhofer IPA measured 7.95 to 16.96 percent lower procurement cost across more than 20,000 time points between October 2025 and May 2026, and puts forecast errors at roughly 3,000 euros per year and megawatt of flexible capacity. At the same time PwC finds 61 percent of utilities stuck in the experimental stage with their AI work. The bottleneck is rarely the model. It sits in the data base, in the price formula itself, and in the question of who owns the control loop in daily operations.
Why imbalance energy became a control problem
Imbalance energy is no longer a footnote in the cost base. It is the price you pay when your schedule and reality drift apart, and it accrues at a resolution nobody corrects by hand: per quarter hour, 96 times a day, all year.
In Germany the duty sits in section 4(2) sentence 2 of the Stromnetzzugangsverordnung: a balanced ratio of feed-in and offtake in every quarter hour. How tightly that frame is drawn today shows in the standard balancing group contract, which has tightened collateral and schedule management duties since October 2024.
- Settlement is symmetrical. An over-covered balancing group can cost just as much as an under-covered one, because there is no price difference between a positive and a negative deviation.
- The gap between 90 and 97 percent forecast accuracy translates straight into imbalance cost in portfolio management.
- Forecast errors cost around 3,000 euros per year and megawatt of flexibly controllable capacity, by the Fraunhofer IPA calculation.
There is a second effect, long underestimated. As long as forecast errors are randomly distributed, they cancel each other out inside the control area. With weather-driven generation they no longer do. When a snow front cuts solar output across a whole bidding zone at once, as happened in the Netherlands in January 2026, every portfolio misses in the same direction. That is exactly when the imbalance price is highest.
How the reBAP is formed and what it punishes
The reBAP has been price-based rather than cost-based since 2022, and it makes up 27.5 percent of the blended price for redispatch without balancing. Its job is to push you into closing open positions on the market before the transmission system operators have to activate reserves. Once you know the three modules, you also understand why the same deviation costs a few euros one day and a five-figure sum the next.
The legal basis are decisions BK6-21-192 of 28 April 2022 and BK6-22-162 of 31 October 2022, embedded in the European Imbalance Settlement Harmonisation Methodology. Settlement runs per quarter hour. Prices range from negative values into four digits.
And occasionally far beyond that. The direct marketer FlexPower documented a quarter hour in which the reBAP jumped to roughly 5,060 euros per megawatt hour at a control area balance of only 245 MW. The cause was the averaging of two bids: one at a realistic 125.04 euros, one at 9,999 euros, an obvious data entry error. That is not a market signal. It is a calculation artefact, and a balance responsible party pays for it anyway.
A reBAP estimate of roughly 5,060 euros per megawatt hour at a 245 MW control area balance, produced by averaging an erroneous 9,999 euro bid with a genuine bid of 125.04 euros.
What data analytics really delivers in a balancing group
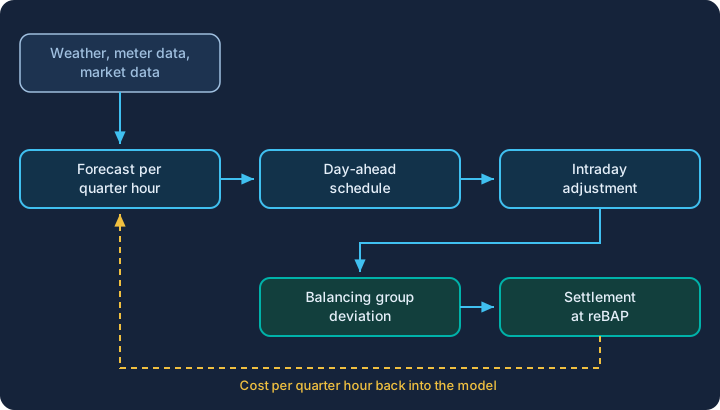
The value does not come from a smoother forecast curve. It comes from better decisions at three points: building the day-ahead schedule, adjusting intraday, and pricing the residual risk. All three hang together, and settlement closes the loop.
Fraunhofer IPA supplies the hard numbers. In a German Kopernikus project on industrial energy flexibility, an in-house AI model was put up against a commercial forecasting service across more than 20,000 time points between October 2025 and May 2026. The result: procurement costs 7.95 to 16.96 percent lower, depending on how long the flexibility ran in one stretch. Asked which two hours of a day were the cheapest, the AI model was right almost twice as often. For optimal quarter-hour windows its hit rate was seven times higher.
For companies it is not the prettiest forecast curve that counts, but the operational benefit.
Can Kaymakci, Fraunhofer IPAThat sentence is the actual point. A forecast whose mean error drops while it still misses the expensive quarter hours has achieved nothing. What has to be measured is the cost effect, not the error metric.
What goes into such models is fairly well mapped out by now: weather ensembles instead of a single run, measured quarter-hour values from your own portfolio, features from market and price data, plus a decision rule that turns forecast uncertainty into a trading decision. The grid side is walking the same path with a different goal. AI load and generation forecasting in the distribution grid serves system security, not the portfolio result.
The measurable lever is the cost effect per quarter hour, not the mean forecast accuracy. Improve the wrong metric and you keep paying.
The European perspective
The German imbalance market is largely harmonised with the rest of Europe, and that noticeably changes what trading strategies earn. Price formation is converging, and the easy money is disappearing with it.
ACER monitoring found that 22 of 24 member states reviewed have fully or largely implemented the Imbalance Settlement Harmonisation Methodology. Twenty transmission system operators across 17 member states use the single pricing of the EU target model, five stick with dual pricing. Nineteen operators in 16 member states have added components such as scarcity incentives. Germany is among them.

The consequences are measurable. After joining the secondary reserve platform PICASSO, the gap between day-ahead price and imbalance price fell by roughly 55 percent in Belgium and by about 20 percent in the Netherlands, from around 50 to 40 euros per megawatt hour. German spreads gave way indirectly as neighbouring zones joined. France moved the other way into mid-2025, driven by lower nuclear availability.
For trading strategies the message is blunt. Rule-based approaches are losing. The Dexter Energy analysis shows rule-based strategies gaining through 2023, flattening in 2024, and having their cumulative gains largely eroded by 2025. Earning money today means anticipating the imbalance price instead of reacting to it. Operator signals arrive too late for that.
Meanwhile the infrastructure underneath the process is shifting. Central balancing settlement through the MaBiS hub and the move to metered quarter-hour balancing both change which data is available when. The 15-minute day-ahead market belongs to the same movement.
Challenges and risks
Analytics does not solve the problem on its own, and part of the risk arrives with it. Three areas deserve attention before budget flows into models.
The data base is the real bottleneck
In the PwC 2026 study, 30 percent of utilities name technical barriers such as data gaps and missing interfaces as their biggest obstacle, 28 percent a lack of skills, 18 percent legal and ethical questions, 16 percent organisational resistance. Not a single company rates itself as advanced. That is the reality behind the headline number of 79 percent AI adoption.
The price formula is not immune to outliers
The FlexPower case above is not an isolated risk, it is a design feature. When the price in certain configurations is derived from the average of very few bids, one bad entry is enough. FlexPower suggests using the average of the cheapest 200 MW on each side instead. For modelling the implication is clear: outliers of this kind cannot be forecast and belong in risk management, not in the training data.
Models learn the old market structure
A model trained on historical prices knows the world before PICASSO. Shrinking spreads and new platforms devalue patterns without the error metric showing it right away. On top of that, complex models raise compute and storage cost and reduce explainability, which matters in a process with reporting duties toward the balancing group coordinator.
The Fraunhofer figures come from a simulation that values procurement cost on the power market only. Grid fees and asset wear stay outside the scope. Anyone carrying 17 percent savings into a business case carries that limitation along with it.
What companies should do now
The starting point is not a model question, it is a measurement question. If you do not know which quarter hours cost you the result, you cannot prove a benefit or justify an investment.

Six steps in a sensible order
-
Make the cost per quarter hour visible
Break imbalance cost down by quarter hour first, then by customer segment and asset type, instead of looking at the monthly balance. The distribution is almost always heavily skewed, with a handful of hours dominating the annual result.
-
Set up a forecasting benchmark
Run several models against the same time series and score them by cost effect, not by mean absolute error. Fraunhofer IPA describes exactly this approach as a benchmark framework.
-
Settle data access before model choice
Measured quarter-hour values, weather ensembles, asset master data and the feedback from imbalance settlement belong in one source. Skip this and every model discussion stays theoretical.
-
Define intraday adjustment as a control loop
Set clear thresholds for when trading happens automatically and when a human decides. Without that boundary you end up with either an unsupervised bot or a model nobody uses.
-
Manage model risk explicitly
A fallback process for model failure, live monitoring of forecast quality in operations, planned retraining after market changes. A model without a fallback layer is an operational risk.
-
Plan the exit from pilot mode
Name the operational owner, build the interfaces into market communication, and fix one metric that is measured the same way before and after go-live. This is exactly where 61 percent of projects stall, according to PwC.
Further Reading
Frequently Asked Questions
Imbalance energy allocates the cost of balancing reserves to whoever caused the imbalance. Anyone running a balancing group submits quarter-hourly schedules for feed-in and offtake to the transmission system operator. When reality deviates, the operator covers the difference and bills it to the balance responsible party. Settlement runs per quarter hour at the reBAP, symmetrically for too little and too much.
Since the redesign by the German regulator the reBAP consists of three modules. Module 1 derives the price component from bids on the European balancing platforms PICASSO and MARI. Module 2 couples the price to the intraday index and enforces a minimum spread of 25 percent, but at least 10 euros per megawatt hour, once the control area balance exceeds 500 MW. Module 3 is a scarcity component that rises parabolically above 80 percent utilisation of the dimensioned reserve capacity. The legal basis are decisions BK6-21-192 of 28 April 2022 and BK6-22-162 of 31 October 2022.
Solid numbers exist for narrow cases. Fraunhofer IPA evaluated more than 20,000 time points between October 2025 and May 2026 in a German Kopernikus project on industrial energy flexibility and found procurement costs 7.95 to 16.96 percent lower, depending on how long the flexibility ran. Forecast errors cost roughly 3,000 euros per year and megawatt of flexibly controllable capacity. The simulation only values procurement cost on the power market, not grid fees or asset wear.
Four sources form the base: measured quarter-hour values from your own portfolio, weather forecasts ideally as an ensemble rather than a single run, asset master data, and the feedback from imbalance settlement. The settlement data is the most important and the most frequently forgotten part, because only it shows which quarter hour actually cost money.
The PwC 2026 study on AI in the energy industry puts numbers on it: 79 percent of utilities have introduced AI, 61 percent remain in the experimental stage, only 25 percent have an AI roadmap, and not a single company rates itself as advanced. Thirty percent name technical barriers such as data gaps and missing interfaces as the biggest obstacle, 28 percent a lack of skills. The jump into operations fails less often on the model than on data and ownership.
Price formation is converging across Europe. ACER monitoring found that 22 of 24 member states reviewed have fully or largely implemented the Imbalance Settlement Harmonisation Methodology, and 20 transmission system operators across 17 member states use single pricing. The practical consequence is shrinking spreads between day-ahead and imbalance prices. In Belgium they fell by roughly 55 percent after joining PICASSO, in the Netherlands by about 20 percent. Simple rule-based trading strategies lose their edge as a result.
Let's collaborate
One contact, a team behind it
Thirty minutes on what you're working on, whether grid, metering, market processes, IT architecture or AI. Afterwards you'll know how we'd approach it and who would sit at the table.
Energy and measurement technology since 2010 · innobu GmbH since 2014 · Based in Schleswig-Holstein, Germany
Whoever pitches also delivers: whoever leads the first call stays your contact right through to the steering committee, with established partners in the project. Direct: info@innobu.com