AI-Based Load and Generation Forecasting: A Core Discipline for Distribution Grid Operators
This article sets out which forecasts a distribution grid operator has to produce, why AI and weather data have become the standard toolkit, how forecast errors drive balancing energy costs directly, and where forecast quality still fails in the low-voltage grid.
Load and generation forecasting in the distribution grid has moved from a planning aid to a regulatory operating duty. Since Redispatch 2.0, a distribution grid operator must deliver plant-level generation forecasts, load forecasts and from them a grid-state forecast about 36 hours ahead, in order to spot congestion early. AI models raise forecast quality measurably: Fraunhofer improved the day-ahead forecast of the distribution grid operator Albwerk by around 40 percent in mean absolute error, and probabilistic models lifted forecast quality at the US grid operator CAISO by around 25 percent. The gain shows up directly in cost, because every forecast error has to be balanced on the intraday market, where prices jump from around 100 euros per MWh during the day to up to 1,000 euros per MWh at the evening peak. The core problem is not the algorithm but the data: the low-voltage grid lacks measurement points, observability is low, and it is exactly there that Section 14a EnWG has been adding heat pumps and wallboxes since 2025. For grid operators and direct marketers, that means solving data quality and grid mapping first, then building forecasting models on top, and measuring forecast quality continuously in operations.
Why forecasting became a core discipline
Forecasting in the distribution grid is no longer a planning aid, it is a regulatory operating duty. Under Redispatch 2.0, distribution grid operators have had to produce plant-level generation forecasts and anticipate grid congestion since October 2021. The build-out of volatile generation and controllable loads makes this task harder every year, while the data base grows only slowly.
For you as a grid operator or direct marketer, the bar has moved. It is no longer about a rough daily plan but about reliable forecasts per grid section that hold up under scrutiny. That is why AI and weather data are turning from a pilot project into a standard tool here.
- Redispatch 2.0 requires generation, load and grid-utilisation forecasts with about 36 hours of lead time.
- Around 800 distribution grid operators are affected, from the small municipal utility to the large area operator.
- Section 14a EnWG has been bringing heat pumps and wallboxes into the low-voltage grid since 2025, and their behaviour is hard to predict. How these loads are controlled is set out in the article on the control box under Section 14a EnWG .
What exactly must be forecast
Distribution grid operators need three interlocking forecast types. The generation forecast predicts output from PV and wind, the load forecast predicts demand, and from both follows the grid-state forecast per grid section. Only the combination lets you spot congestion before it happens.
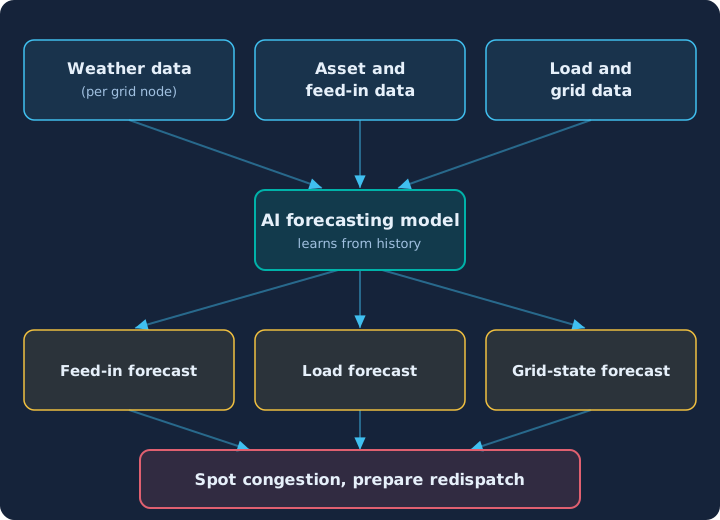
- Generation forecast: a plant- and park-level prediction from weather forecasts per grid node, for every generation asset in the grid area.
- Load forecast: demand per grid section, increasingly shaped by electric mobility and heat pumps.
- Grid-state forecast: the merge into a reliable statement about looming overloads. Tools such as GridSage from the ZSW process weather, asset and grid data in a single step.
Why AI and weather data became standard
AI models deliver measurably better forecasts than classic methods when generation is volatile. They combine several weather models, learn from historical deviations and process data per grid node at an accuracy that is out of reach by hand.

The gain shows up directly in the error metric. A better mean absolute error means less balancing energy and therefore lower cost, without any extra grid hardware.
- Fraunhofer improved the day-ahead forecast of the distribution grid operator Albwerk by around 40 percent in mean absolute error.
- Probabilistic models lifted forecast quality at the US grid operator CAISO by around 25 percent against the benchmark.
- Outdoor temperature and global radiation are the most important drivers in grid areas with many PV systems.
- Several weather models are combined by weighting rather than replaced by a single model. Data availability stays the limiting factor.
The German and EU perspective
The regulatory frame makes forecasting binding and auditable. The EU Clean Energy Package of 2019 turned distribution grid operators into active players in grid operation, and Germany made this concrete through Redispatch 2.0 and Section 14a EnWG. From 2029, uniform control and documentation requirements apply to all grid operators.
Section 14a EnWG has applied since 1 January 2024, and documentation duties for controllability have applied since 1 March 2025. For the winter of 2025/2026, the redispatch volume is estimated at around 17 TWh, about 30 percent less than the year before. The drop shows that grid expansion and better forecasting work together.
Forecasting does not stand alone. It feeds the same market processes that dynamic tariffs need, described in the article on tariff models for 2026 . Where demand becomes controllable, the value of a good forecast grows.
Forecast errors as a cost driver
Every forecast error has a price. When actual feed-in deviates from the forecast, the difference must be procured on the intraday market or through balancing energy. During scarce hours that pushes costs into the five-figure range quickly, which is why forecast quality feeds straight through to the balance sheet. The same mechanics apply on the market side, described in AI in balancing group management.
- Day-ahead prices sit at around 100 euros per MWh, evening peaks at up to 1,000 euros per MWh.
- More precise forecasts cut the need for control and balancing energy and dampen consumer costs over time.
- Battery storage balances positive and negative forecast errors within seconds, but does not replace a good forecast. How storage and AI work together is shown in the article on virtual power plants .
Challenges and risks
The biggest hurdle is not the algorithm but the data. The low-voltage grid lacks measurement points, observability is low, and data comes from systems by different vendors with varying standards. Without clean data mapped correctly to the grid topology, every forecast stays uncertain.

- Missing observability: metering in the medium- and low-voltage grid is the exception, and many secondary substations deliver no real-time data.
- Mapping the data: smart meter and inverter data must be assigned correctly to the grid topology, otherwise the model computes past the real grid.
- Data quality before method: data quality and data protection limit model quality more than the choice of algorithm.
- Model drift: AI forecasts need continuous monitoring, or models drift when consumption patterns change. Part of the data base comes from the smart meter rollout .
What companies should do now
Forecasting belongs in day-to-day operations, not in an innovation lab. Grid operators and direct marketers solve data quality and grid mapping first, then build forecasting models on top and measure forecast quality continuously. Tracking forecast errors systematically cuts balancing energy costs and meets the regulatory duties at the same time.
Four priority steps
-
Data base first
Keep measurement points, grid topology and master data clean before scaling models. A wrongly mapped asset distorts the forecast for the whole grid section.
-
Measure forecast quality
Anchor mean absolute error as a metric in operations, not only in the project. Only continuous measurement reveals model drift early enough to correct it.
-
Decide make or buy
Check existing tools and service providers instead of building every forecast in-house. For many distribution grid operators a specialised forecasting service is cheaper than an in-house data science team.
-
Keep human control
Monitor AI forecasts, document them and correct for model drift. Responsibility for safe grid operation stays with the operator, not with the model.
Forecasting is one building block of the digital energy transition, not a standalone topic. It feeds the same digitalisation as congestion management, described in the article on Redispatch 3.0 . Only forecasting, market process and grid control together form a complete picture.
Further reading
Frequently asked questions
Since Redispatch 2.0, a distribution grid operator must deliver three interlocking forecasts: a plant-level generation forecast for PV and wind, a load forecast per grid section, and from both a grid-state forecast that spots looming congestion. The forecasts run about 36 hours ahead. Forecasting is therefore not optional but a regulatory operating duty.
AI models deliver clearly more accurate forecasts than classic methods when generation is volatile. They combine several weather models, learn from historical deviations and process data per grid node. Fraunhofer improved the day-ahead forecast of the distribution grid operator Albwerk by around 40 percent in mean absolute error, which translates directly into cheaper balancing energy.
When actual feed-in deviates from the forecast, the difference must be covered on the intraday market or through balancing energy. Day-ahead prices sit at around 100 euros per MWh, evening peaks reach up to 1,000 euros per MWh. During scarce hours a larger forecast error pushes costs into the five-figure range within hours.
Not the algorithm, but the data. The low-voltage grid lacks measurement points, observability is low, and data comes from systems by different vendors with varying standards. Without clean data mapped correctly to the grid topology, every forecast stays uncertain. And it is exactly this level where Section 14a EnWG is now adding heat pumps and wallboxes.
Fix the data first: keep measurement points, grid topology and master data clean before scaling forecasting models. Then anchor forecast quality as a metric in day-to-day operations, not only in a project. Check existing tools and service providers instead of building every forecast in-house, and monitor AI forecasts continuously so models do not drift when consumption patterns change.
Let's collaborate
One contact, a team behind it
Thirty minutes on what you're working on, whether grid, metering, market processes, IT architecture or AI. Afterwards you'll know how we'd approach it and who would sit at the table.
Energy and measurement technology since 2010 · innobu GmbH since 2014 · Based in Schleswig-Holstein, Germany
Whoever pitches also delivers: whoever leads the first call stays your contact right through to the steering committee, with established partners in the project. Direct: info@innobu.com